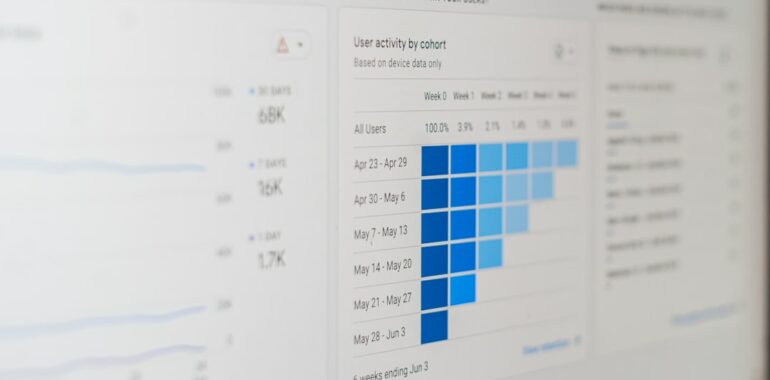
The Ultimate Dashboard: Key Metrics Every Early Stage Startup Needs

Learn how to create the ultimate metrics dashboard that every early stage startup needs to track for success.
Introduction
In the fast-paced world of startups, having a clear view of your business’s performance is crucial. A well-designed startup metrics dashboard serves as the central hub for tracking vital indicators, enabling founders to make informed decisions swiftly. This guide will walk you through the essential metrics every early stage startup should monitor and how to effectively create a startup metrics dashboard that propels your venture towards success.
Why a Metrics Dashboard Matters
A startup metrics dashboard consolidates key performance indicators (KPIs) into a single, easy-to-read interface. This offers several advantages:
- Real-Time Insights: Monitor your startup’s health at a glance.
- Informed Decision-Making: Base your strategies on concrete data.
- Resource Allocation: Identify which areas need more attention and investment.
- Early Problem Detection: Spot trends that could indicate potential issues before they escalate.
Core Metrics to Include in Your Dashboard
1. Customer Acquisition Cost (CAC)
CAC measures the cost of acquiring a new customer. It includes marketing expenses, sales team salaries, and any other costs related to customer acquisition. Keeping this metric in check ensures that your marketing strategies are efficient and sustainable.
2. Lifetime Value (LTV)
LTV estimates the total revenue a business can expect from a single customer account. Comparing LTV with CAC helps you understand the long-term profitability of your customer base.
3. Retention Rate
Focusing on retention rate is crucial for early stage startups. High retention indicates customer satisfaction and loyalty, while low retention may signal underlying issues with your product or service.
4. Churn Rate
Churn rate is the percentage of customers who stop using your product over a specific period. Monitoring churn rate helps you identify and address factors contributing to customer loss.
5. Monthly Recurring Revenue (MRR)
MRR tracks the predictable revenue your startup earns each month. It’s a fundamental metric for understanding your financial stability and growth trajectory.
6. Burn Rate
Burn rate indicates how quickly your startup is spending its capital. Keeping an eye on burn rate ensures you maintain enough runway to reach profitability or secure additional funding.
7. Engagement Metrics
Metrics such as daily active users (DAU) or time spent on your platform provide insights into how users interact with your product. High engagement often correlates with higher retention and LTV.
Building Your Startup Metrics Dashboard
Choose the Right Tools
Selecting the appropriate tools is the first step in creating an effective startup metrics dashboard. Platforms like Tableau, Google Data Studio, or customized solutions offered by TOPY AI Revolution can help you integrate and visualize your data seamlessly.
Integrate Key Data Sources
Ensure your startup metrics dashboard pulls data from all relevant sources, including CRM systems, marketing platforms, and financial software. This integration provides a comprehensive view of your startup’s performance.
Utilize AI for Deeper Insights
Leveraging AI-driven tools can enhance your startup metrics dashboard by providing predictive analytics and actionable insights. TOPY AI Revolution, for example, not only assists in finding co-founders and generating business plans but also offers advanced analytics to optimize your startup’s performance.
Design for Clarity and Actionability
Your dashboard should present data in a clear and concise manner. Use visualizations like graphs, charts, and color-coded indicators to highlight important trends and anomalies. The goal is to make your startup metrics dashboard actionable, so you can quickly identify areas that need attention.
Benefits of an Effective Metrics Dashboard
Implementing a comprehensive startup metrics dashboard provides numerous benefits:
- Enhanced Visibility: Gain a holistic view of your startup’s performance.
- Better Collaboration: Share insights with your team to align on goals and strategies.
- Scalability: Easily add or modify metrics as your startup grows and evolves.
- Competitive Advantage: Stay ahead by making data-driven decisions faster than competitors.
Best Practices for Maintaining Your Dashboard
- Regular Updates: Keep your data current to ensure accurate insights.
- Simplify Metrics: Focus on the most impactful metrics to avoid information overload.
- Automate Data Collection: Reduce manual errors and save time by automating data integrations.
- Review and Iterate: Continuously assess the effectiveness of your startup metrics dashboard and make improvements as needed.
Conclusion
Creating the ultimate startup metrics dashboard is a vital step for any early stage startup aiming for success. By tracking the right metrics and leveraging advanced tools like TOPY AI Revolution, you can gain actionable insights, make informed decisions, and steer your startup towards sustained growth.
Ready to take your startup to the next level? Get started with TOPY AI Revolution today!


